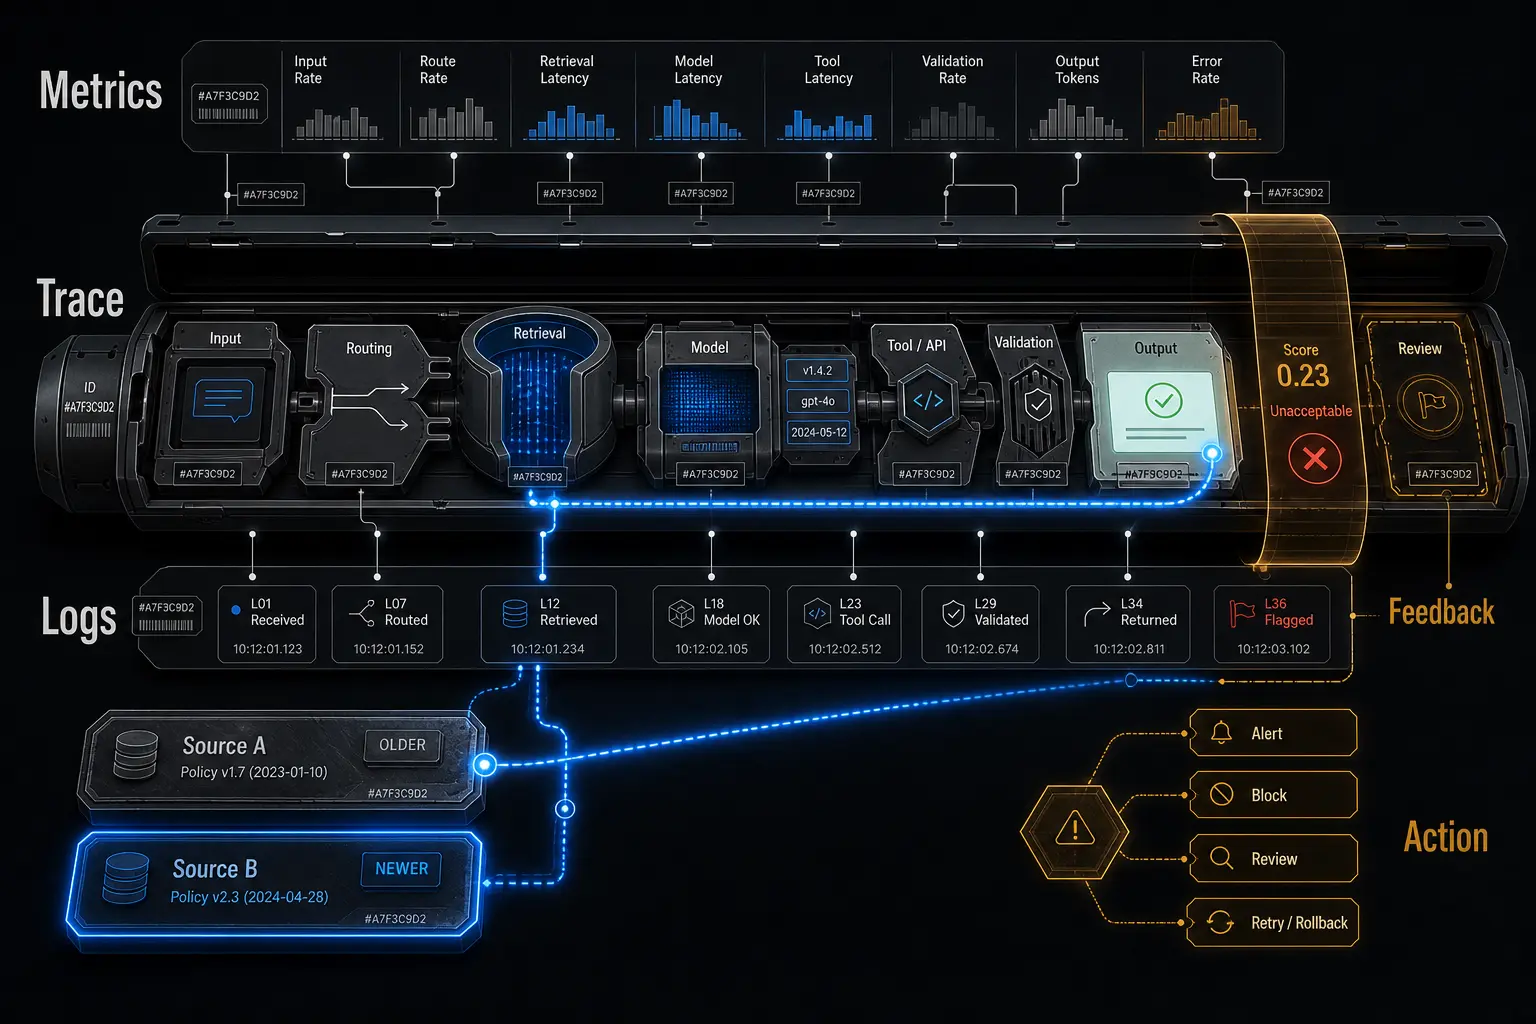
AI observability is the ability to inspect a production AI system’s execution, behavior, output quality, latency, cost, and failures. Conventional uptime monitoring remains necessary, but it is insufficient: a service can return a successful response while producing an unsupported, irrelevant, inconsistent, or operationally wrong answer. The system ran. The result still failed.
A useful production view connects the user input, workflow path, retrieval results, model calls, tool activity, validation, final output, evaluations, and feedback under the same request trace. That connected evidence makes it possible to distinguish an infrastructure failure from a retrieval problem, generation error, orchestration defect, or unresolved governance decision. The practical objective is not to collect every available signal. It is to capture enough evidence to detect a problem, identify its cause, and take an appropriate action.
Table of Contents
- What AI Observability Means in Production
- The Observability Model: Traces, Metrics, Logs, and Evaluations
- What to Monitor Across an AI Workflow
- How to Instrument an AI System for Diagnosis
- Turning Observability Signals Into Operational Action
- FAQ
- What to Do Next?
What AI Observability Means in Production
AI observability is the ability to reconstruct what an AI application did from input through final output, then assess both the execution path and the result. It should answer four separate questions: Did the workflow complete? What path did it take? Was the output acceptable? What caused an unacceptable result?
AI monitoring usually reports predefined conditions: availability, error rates, latency, usage, or queue depth. Observability supports investigation beyond those anticipated checks by preserving connected evidence about individual requests. A monitor might report that error rates remain low while reviewers reject more answers. Observability should let an operator inspect the affected traces and determine whether the change came from a prompt version, retrieval index, model configuration, workflow branch, or source-quality problem.
Consider a request that returns a 200 status in two seconds but cites the wrong policy document. Infrastructure monitoring reports a healthy endpoint. Workflow monitoring reports a completed run. Neither establishes that the answer used the governing source. The execution was technically successful while the semantic result was unacceptable.
This distinction matters because production AI applications combine deterministic and probabilistic components. Routing rules, permission checks, API calls, schema validation, and database writes can be tested against explicit conditions. Model-generated language requires different evidence: relevance, grounding, instruction adherence, citation support, and task-specific acceptance. A valid output schema proves that required fields exist and have permitted types. It does not prove that their values are supported by the source.
The minimum useful observability unit is therefore one request or task connected to its input, configuration, execution path, dependencies, output, evaluation, and eventual feedback. Tool calls, memory, planning, and autonomous decisions should be included only when the application actually contains those components. A model call inside a deterministic workflow is not automatically an agent.
The Observability Model: Traces, Metrics, Logs, and Evaluations
A request-level trace is the end-to-end record of one task or workflow run. Within it, spans represent timed operations such as input validation, retrieval, an LLM call, a tool invocation, output validation, or a database write. Parent-child relationships show which operation initiated another, while timestamps show where time was spent.
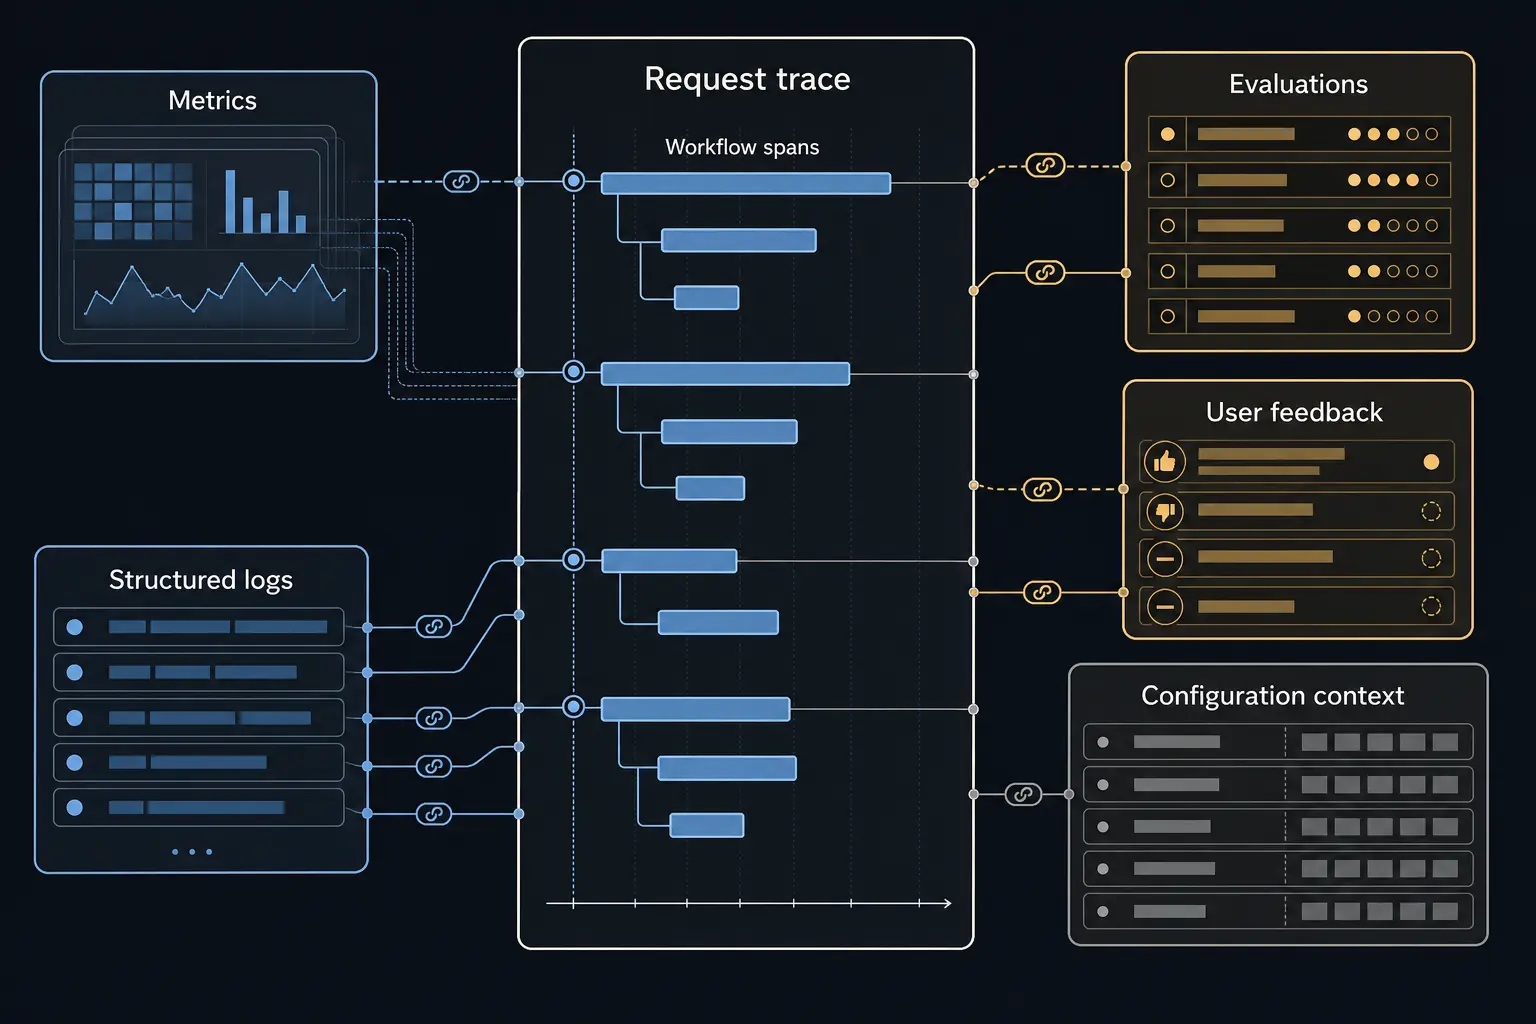
Metrics aggregate behavior across many requests. Useful examples include latency distributions, workflow failure rates, retry counts, model usage, attributed cost, tool success rates, retrieval misses, and evaluation trends. Metrics reveal patterns, but they rarely explain an individual failure. An increase in response time could originate in retrieval, model generation, a rate-limit retry, queue delay, or a downstream API. The relevant traces decompose the total into its component spans.
Logs record event-level diagnostic information: a route selection, validation outcome, typed error, permission rejection, retry decision, or escalation reason. Structured fields are more useful than an unsearchable sentence because they can be filtered and joined consistently. A timeout event, for example, should identify the affected dependency, operation, trace, retry attempt, and workflow version, while avoiding credentials and unnecessary payload data.
Evaluations are also production observability signals, not merely offline testing tools. Depending on the task, they can assess groundedness, relevance, citation support, completeness, instruction adherence, schema compliance, or a domain-specific acceptance condition. No single quality score captures overall system quality. Model-generated evaluators are themselves probabilistic and should be calibrated against representative examples and human judgment rather than treated as unquestionable ground truth.
User feedback and downstream outcomes add another layer. Explicit feedback, such as a reviewer rejecting an answer, should remain distinct from inferred behavior, such as assuming that a repeated query indicates dissatisfaction. Both can be useful, but they carry different evidential weight.
Stable correlation identifiers connect traces, metrics, logs, and evaluations. Effective LLM observability also records configuration context, including the model identifier, prompt or template version, workflow version, retrieval index version, enabled tools, and relevant feature flags. Without those references, a team can see that behavior changed but struggle to identify what changed with it.
What to Monitor Across an AI Workflow
The right monitoring inventory follows the application’s architecture, risk, and known failure modes. A retrieval-assisted support answer needs source and citation evidence. A workflow that changes external records needs tool permissions and side-effect tracking. A simple classification call does not need planning or memory telemetry that does not exist.
- Inputs and context: request type, input size, relevant task or conversation context, permissions, and input-validation results. Sensitive content may require redaction, hashing, restricted access, sampling, or omission.
- Workflow execution: selected route, branch decisions, step sequence, retries, queue delay, state transitions, completion status, and human approval events. AI workflow monitoring should expose deterministic decisions surrounding the model call.
- Model calls: model and configuration identifier, prompt version, response status, latency, usage units, attributed cost where available, refusal state, retry behavior, and structured-output validity. LLM monitoring covers this layer, not the complete application.
- Retrieval: query, filters, candidate sources, rank or score, selected chunks, source authority, effective version, index version, retrieval latency, and support between evidence and answer.
- Tools and APIs: selected tool, sanitized arguments, permission decision, duration, result status, retries, side effects, and whether the returned result was incorporated correctly.
- Outputs and quality: final response, output schema, citations, policy checks, groundedness, relevance, completeness, consistency, instruction adherence, reviewer judgment, and explicit user feedback.
- Operational behavior: end-to-end and component latency, throughput, timeouts, error rates, rate limits, queue depth, dependency failures, and usage or resource trends.
Each signal should correspond to a failure that matters or a decision someone can make. Token usage is useful for cost and capacity analysis, but it is not a correctness measure. Retrieval scores require interpretation within the retrieval system that produced them; they are not universal quality grades. Detection signals and diagnostic context should also remain distinct. An alert can detect rising tool failures, while the associated traces identify the tool, arguments, dependency, branch, and affected outputs.
Illustrative example: A user asks, “What is the cancellation window for annual plans?” The trace contains an older approved FAQ stating, “Cancellations are accepted within 30 days,” ranked first, and a newer approved policy stating, “Annual plans are non-refundable after purchase,” ranked second. The generated answer says, “Annual plans can be cancelled within 30 days.” The system is expected to answer from approved policy sources and escalate unresolved contradictions, but source precedence beyond the recorded effective dates is not assumed.
The trace shows that the workflow completed, retrieval ran, the output schema passed, and no API or tool failed. Those rule-based checks establish structural execution only. For these explicit statements, a comparison rule can flag conflicting cancellation terms and different effective dates; it would not resolve every form of ambiguous language. Unless governance rules explicitly define precedence, the rule cannot establish which source governs. An interpretive evaluation can flag that the answer contradicts the newer policy and relies on the older FAQ, while an authorized reviewer must confirm the governing source.
The proposed response is to withhold the answer, route the conflict for review, and record both source identifiers and effective dates. In this hypothetical scenario, a reasonable diagnosis is a retrieval‑ranking or source‑governance failure, compounded by orchestration that allowed the model to resolve conflicting evidence without escalation, rather than an infrastructure failure. If the newer policy ranked first but the model still answered “30 days,” the diagnosis would shift toward generation grounding, prompt behavior, or post-generation validation. The diagnosis is acceptable only if another reviewer can inspect the same trace, versions, and sources and reach the same layer-level explanation.
How to Instrument an AI System for Diagnosis
Instrumentation should begin with a system map, not a dashboard. Identify entry points, workflow steps, model calls, retrieval systems, tools, databases, queues, validation stages, and human-review boundaries. Then define the trace around a meaningful unit of work. One user request may initiate several model calls and tool invocations while still belonging to a single root trace.
Assign stable identifiers at the levels the application needs: request, session or task, workflow run, model call, retrieval event, tool call, output, and evaluation. Preserve parent-child relationships and causal sequence. Timing alone cannot reliably show that one event caused another, especially when branches run concurrently or queued work resumes later.
Use structured event fields for values that need filtering or aggregation. These commonly include operation type, status, duration, failure category, component version, retry count, and escalation state. Store version references for prompts, models, workflows, tools, policies, and retrieval indexes so a behavioral change can be compared with the configuration that produced it. Separate searchable metadata from larger telemetry payloads rather than forcing every prompt or retrieved document into an indexed log.
For a retrieval-assisted request, an instrumentation sketch might contain one root trace with child spans for input validation, retrieval, model generation, citation validation, and output delivery. The retrieval span records the index version and selected source identifiers. The generation span records the model configuration and prompt version. Citation validation links claims or citations back to the selected sources. Shared request and trace identifiers let a reviewer connect the delivered answer to the exact configuration and evidence used.
This connection is central to generative AI observability: the generated output is useful diagnostic evidence only when it remains attributable to its source context, execution path, and evaluation. Typed failure events improve that evidence. Distinguish a timeout from an invalid schema, permission rejection, rate limit, retrieval miss, tool failure, failed evaluation, or human-review escalation. Different failures require different owners and responses.
More capture is not automatically better. Apply data minimization, access control, redaction, retention rules, and sampling before storing raw inputs, outputs, or tool payloads. Credentials and unrestricted personal data should not enter telemetry. High-risk actions and failed runs may justify detailed restricted evidence, while routine low-risk traffic may be sampled or summarized.
The observability pipeline must also be monitored. Missing spans, dropped events, broken identifiers, inconsistent clocks, or silently failed evaluations can produce false diagnoses. Test whether expected events arrive, whether joins succeed, and whether trace completeness changes after releases. Telemetry is a production dependency once incident decisions rely on it.
Turning Observability Signals Into Operational Action
Collected data becomes operational only when a signal can change a decision: alert, investigate, block, route, retry, roll back, revise, or accept. Every alert should therefore have a meaningful condition, an owner, and a permitted response. Alerting on every available metric creates noise without improving control.
Separate hard failures from quality degradation. Invalid output schemas, unavailable dependencies, unauthorized tool actions, and incomplete workflows are often explicit failures. Unsupported answers, retrieval misses, changing evaluation distributions, and rising reviewer rejection indicate degraded behavior even if requests continue to complete.
Thresholds should reflect a service requirement, established baseline, or risk boundary. Dynamic baselines can expose unusual changes, but they still require interpretation. Segment AI monitoring by workflow version, model configuration, request type, language, retrieval index, tool, or risk class. Aggregate averages can hide a severe failure limited to one branch or configuration.
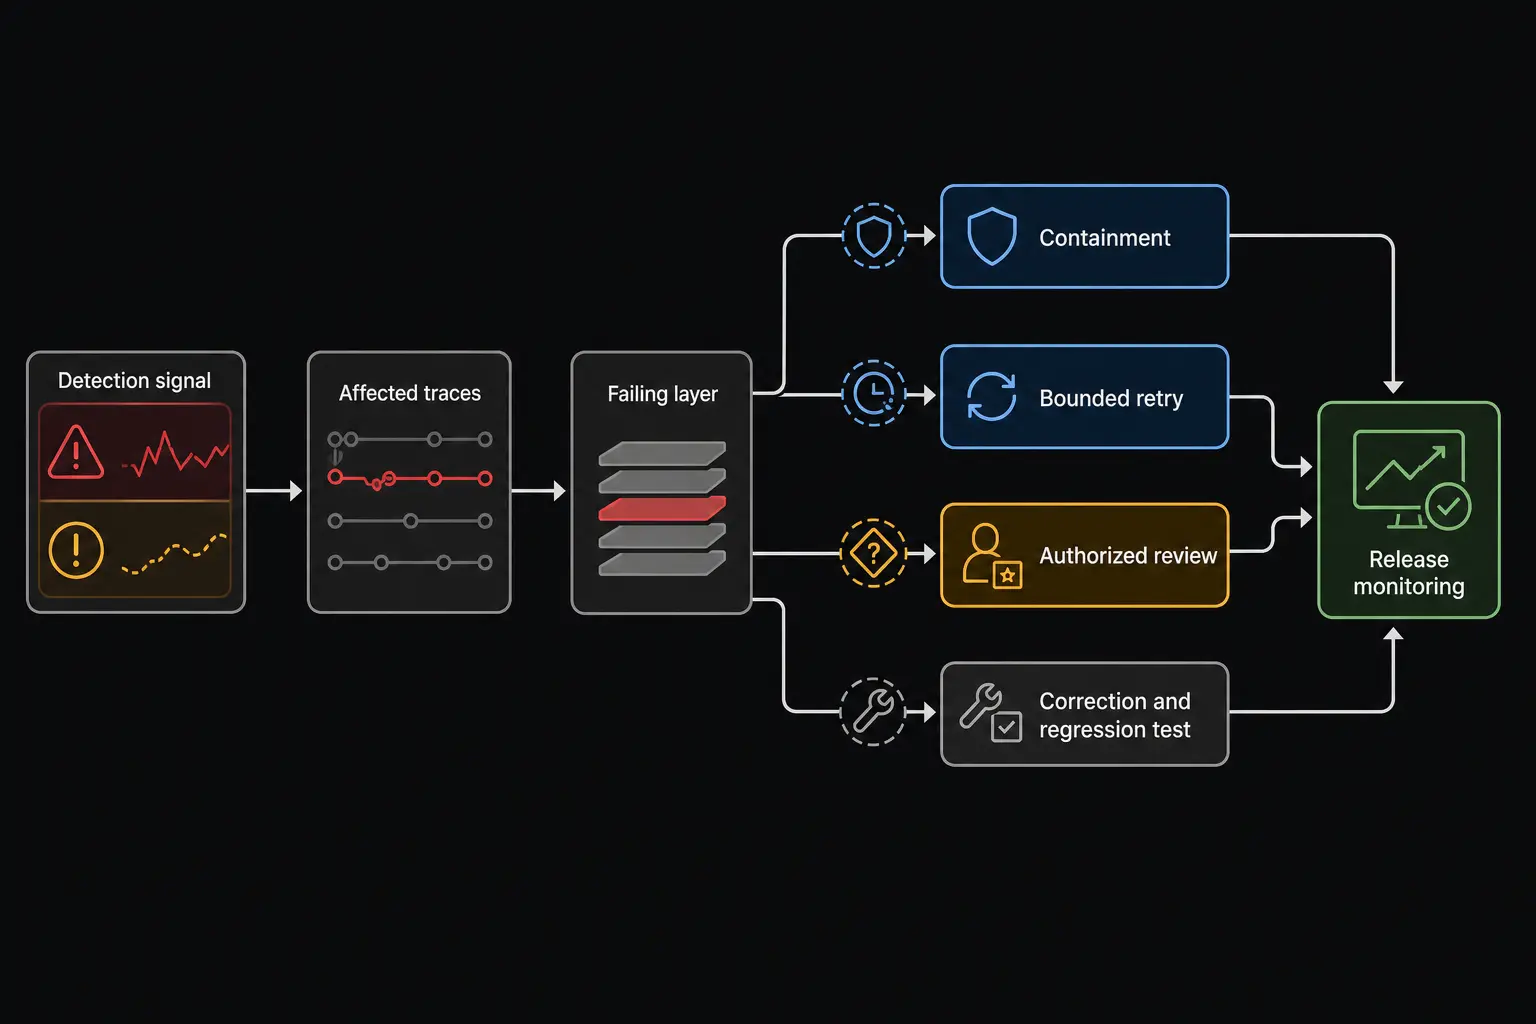
A practical incident path is to detect the condition, identify affected traces, classify the failing layer, contain the impact, correct the relevant component, replay or retest representative cases, and monitor the release. If unsupported-answer evaluations cluster around one retrieval index version, operators can inspect representative traces, route the affected answer type for review if risk warrants it, correct the source or retrieval rule, and rerun a defined regression set before restoring normal handling.
Automated recovery is appropriate when the failure and response are bounded. A transient dependency timeout might justify a limited retry. Conflicting policy evidence or an uncertain high-impact action should stop for authorized review. Retrying every failure can duplicate side effects, increase cost, and conceal deterministic defects.
Observed failures should feed regression datasets, evaluation criteria, prompts, retrieval rules, workflow validation, and operating documentation. Observability coverage also needs review whenever the architecture changes. A new tool, source, branch, or approval stage creates a new place where behavior can diverge and a corresponding need for evidence.
FAQ
Do you need to store full prompts and outputs for AI observability?
No. Full payload storage is not universally required and may be inappropriate for sensitive workflows. Alternatives include structured metadata, redacted excerpts, content hashes, source identifiers, sampled payloads, restricted diagnostic capture, short retention periods, and separate access controls. The decision should reflect diagnostic need, operational risk, and applicable legal or organizational requirements. Store enough evidence to reconstruct the relevant failure without retaining content that serves no defined purpose.
What to Do Next?
Select one high-value or high-risk AI workflow and draw its path from input to output, including deterministic logic, model calls, retrieval, tools, validation, and human review. Identify three to five operationally meaningful failures. For each one, define its detection signal, required trace context, owner, and permitted response.
Create a one-page observability map covering the workflow component, possible failure, signal, diagnostic context, alert or review condition, owner, and response. Then run one deliberately introduced failure or synthetic ambiguous input through the system. Confirm that another person can reconstruct the request, relevant versions, component events, output, evaluation, and decision without relying on undocumented knowledge.
Turn Observability Findings Into Controlled Workflow Tests
Learn how to test real inputs, failure paths, exception routing, retries, and downstream consistency before increasing workflow autonomy.
Once telemetry reveals where a system can fail, this guide explains how to test those failure modes before expanding automation.
Read the article